

8,000 schools use Gynzy
92,000 teachers use Gynzy
1,600,000 students use Gynzy
General
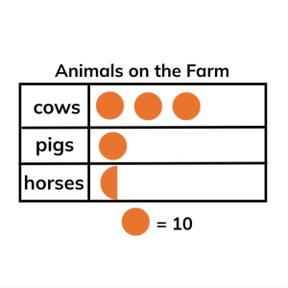
Students will learn to read and interpret a scaled picture graph. They will learn the parts of the graph. They will read several picture graphs and answer the questions about them.
Standards
CCSS.Math.Content.3.MD.B.3
Learning objective
Students will be able to read a scaled picture graph.
Introduction
Students begin by discussing when they have seen or used graphs. Examples given are when reading science or social studies text, or keeping track of money earned during a fundraiser.
Instruction
To begin, students learn that every graph has a title and where that is located. They learn about the labels on the graph that go with category, or topic. They brainstorm to think of labels that would go with a title such as “How I Get to School.” Following this is instruction on the use of symbols with picture graphs. Students find out that the value of the symbol can be changed as needed to reflect the data in the graph. Using a drag and drop activity, they complete an exercise computing questions such as if a triangle = 3, how much would 4 triangles equal. Students also receive instruction and practice on working with half a symbol. The lesson concludes with two graphs to interpret and answer questions about along with the 10-question quiz.
Quiz
Students respond to ten multiple-choice and true/false questions
Closing
Students will use clues to discover the value of the symbol on a picture graph. They will generate two questions to ask their class about the picture graph.
The online teaching platform for interactive whiteboards and displays in schools
Save time building lessons
Manage the classroom more efficiently
Increase student engagement
Discover more!
About Gynzy
Gynzy is an online teaching platform for interactive whiteboards and displays in schools.
With a focus on elementary education, Gynzy’s Whiteboard, digital tools, and activities make it easy for teachers to save time building lessons, increase student engagement, and make classroom management more efficient.


