

8,000 schools use Gynzy
92,000 teachers use Gynzy
1,600,000 students use Gynzy
General
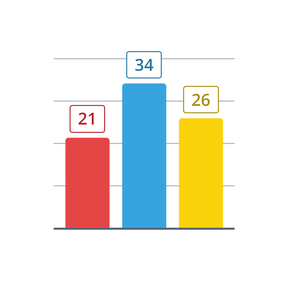
Make single- or multi-bar charts from data given in a table, quickly and easily. Add your own data or use randomly generated data. Practice reading and creating bar charts with students.
Explanation
The tool opens to the editing screen. The table is on the left and the empty bar chart is on the right. Add names for the bars in the left column of the table and the values in the right column. Once you have added a value, it appears immediately in the bar chart on the right. Add a title above the table. Select “Save” to display the bar chart without the table. The tool automatically adds horizontal marking lines. Select the pencil icon to return to the editing screen. Click the ‘plus’ or ‘minus’ buttons to modify the horizontal marking lines.
In the top-right there are two buttons: Refresh and Generate. Use these to empty the table or create a table with randomly generated data, respectively.
Settings
You can select either a single bar chart or a grouped bar chart. In addition, you can select how to display the values after the bar chart has been saved. When you select “Reveal values on click”, you are able to reveal the bar chart values one by one.
The online teaching platform for interactive whiteboards and displays in schools
Save time building lessons
Manage the classroom more efficiently
Increase student engagement
About Gynzy
Gynzy is an online teaching platform for interactive whiteboards and displays in schools.
With a focus on elementary education, Gynzy’s Whiteboard, digital tools, and activities make it easy for teachers to save time building lessons, increase student engagement, and make classroom management more efficient.
